Auto Bild's Papenburg Test --
Auto Bild released an article that gave the Prius very poor high speed
mileage
Concerning Bill Moore's statement about a Prius using 250Wh (Watt-hours)
per mile in an http://www.evworld.com/
article; here are some real
numbers for the 2004 Prius & its energy consumption. First let’s start
with a set of environmental variables so that we can really compare
apples to apples and then let’s look at energy used at different speeds
under those very influential environmental variables. Update July 30th,
2007 -- This portion of the web site has had a marked increase in visits
recently & I understand that it has been for Wh/mile comparisons to
other vehicles & technologies so, I have removed the crosswind that was
present & turned the AC to OFF because many folks were overlooking the
fact that a detrimental crosswind was present & were quoting this table
without acknowledging the detrimental crosswind nor the AC being ON.
RRR: .001144 Road Rolling Resistance (smooth
asphalt roads)
TRR: .007 Tire Rolling Resistance
Cd: .26 Aerodynamic Coefficient of Drag
FA: 2.16m^2 Frontal Area in meters squared
cwCd: 1.4e-5 (crosswind correction for Cd)
cwFA: 8.5e-5 (crosswind correction for FA)
MPH
Watt hours per
mile
% of Energy used to Overcome
Aerodynamic Drag
40
152.8 Wh
29.8%
45
181.3 Wh
31.9%
50
190.8 Wh
37.3%
55
202.9 Wh
42.5%
60
215.5 Wh
47.6%
65
233.4 Wh
51.6%
70
250.3 Wh
55.8%
75
268.5 Wh
59.7%
80
287.8 Wh
63.4%
As you can see, Bill is being quite fair in his 250 Watt hours per mile
quote in his article-response, as in this real-world example it would
fall somewhere in between 70-75 MPH.
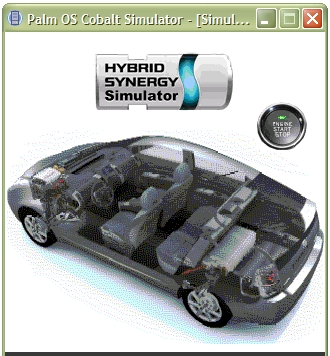
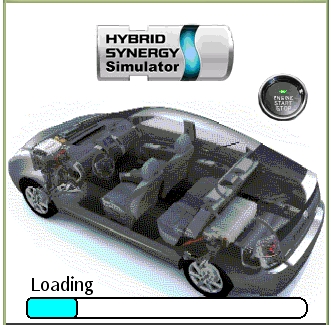
These screens are what you see when you
start the simulator. Notice that the keypads have been left off these
photos; these kinds of graphics cause larger files on the web. You actually
need to press the Prius Start button to load the
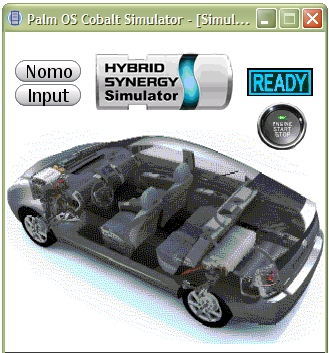
program. The second screen shows the 'Start' button in a 'down' state &
you can watch the 'Loading' process by observing the progress bar running along the bottom. The third
screen shows the "READY" light, just like in our Prius, which comes on
along with the 'Nomo' & 'Input' navigation buttons once the simulator has
loaded. This process only takes about 5 seconds on most Palm OS 5x
or higher machines.
Scroll down for more:
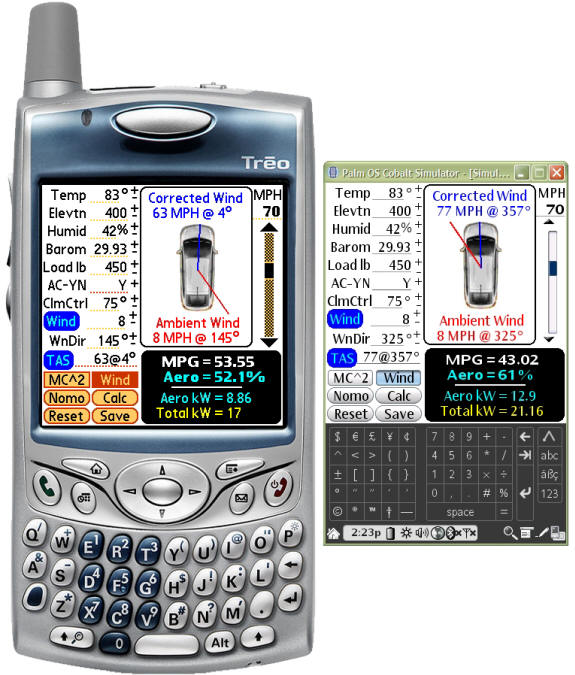
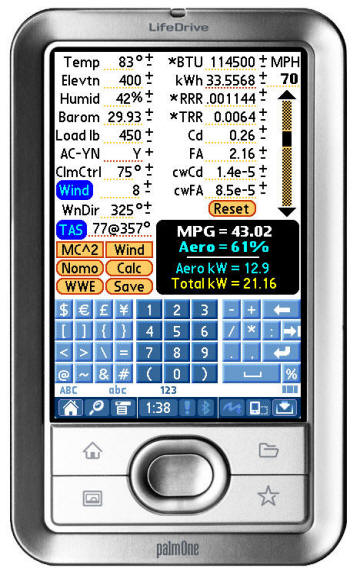
The two Prius 'Energy Use'
simulators below have been programmed with identical variables except
for an 8 MPH wind in opposite directions.
The Treo 650 on the left illustrates a crosswind/tailwind @ 8 MPH; while
the OS6 simulator on the right is showing a wind from exactly the
opposite direction. Notice
what an 8 MPH wind can do to help
or hinder the Prius’ MPG or fuel mileage.
The Treo shows us 53.55 MPG while the screen on the right shows us 43.02
MPG --- ONLY THE WIND DIRECTION is
causing the Prius to get more than a 10 MPG difference!!
Interestingly, an 8 MPH wind is very difficult for us to perceive
while traveling on our highways without referencing a waving flag.
Trees, grass & bushes move almost imperceptibly in
these 8 MPH winds so, we
often think there is no wind at all & wonder why our cars do better some
days than others.
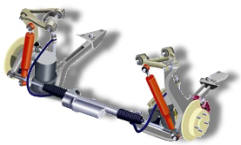
Rear Wheel Steering & Headlamps that follow our Steering: If our vehicles were fitted with
solid-state anemometers as shown below or like I show later
on, directional
headlamps or 'Adaptive Front Lighting' like the
demo below or as can be found at
http://www.lexus.com/models/gs/exterior.html#frontlighting & rear wheel
steering as illustrated here by Delphi
http://www.delphi.com/manufacturers/auto/chsteer/steering/electric/activerear/
; then our vehicle ECUs could calculate, like the Synergy Simulator does now,
what the 'Corrected Wind Angle' composite is, what the 'TAS' or 'True Airspeed'
is and then appropriately steer the rear wheels & turn our headlamps so that the body
of the vehicle approaches the Corrected Wind Angle head on. Calculations
show that this can increase vehicle mileage by as much as another 15%. It
might look a little bit like a dog running sideways down the road but, as soon
as folks knew that meant fuel savings; it would likely be considered cool
technology!
Nice thing is, it would all be automated and controlled by our ECUs.
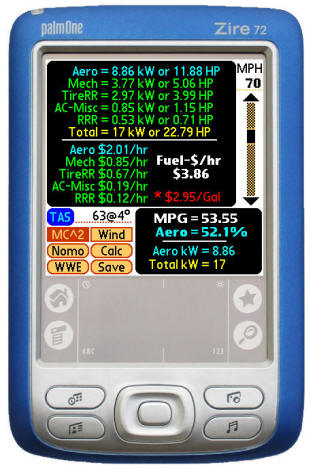
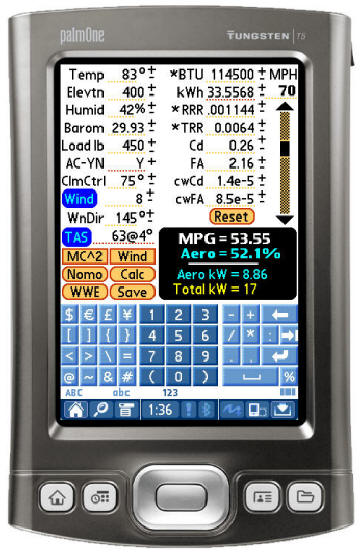
Below, the Blue Zire 72 PDA shows the energy breakdown for the
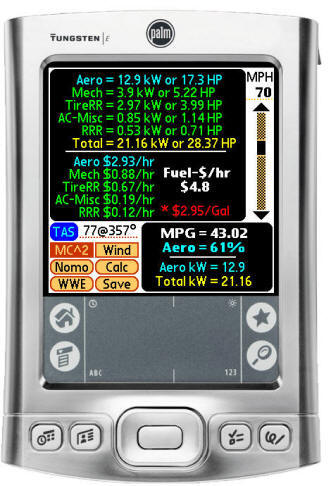
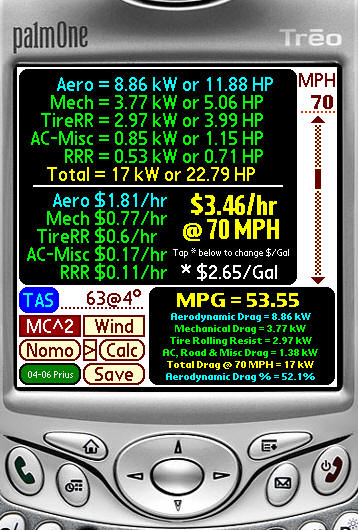
145° wind giving 53.55 MPG. The Tungsten E unit shows the energy breakdown caused by a wind
from 325° resulting in 43.02 MPG. Notice, in each screenshot how much
energy, in particular, is being used to overcome 'Aerodynamic Drag' @ 70 MPH.
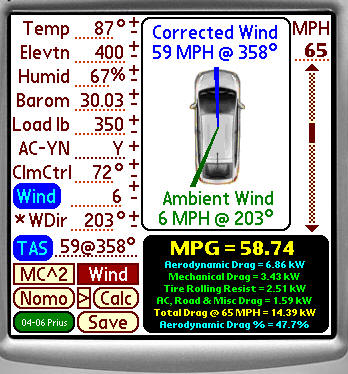
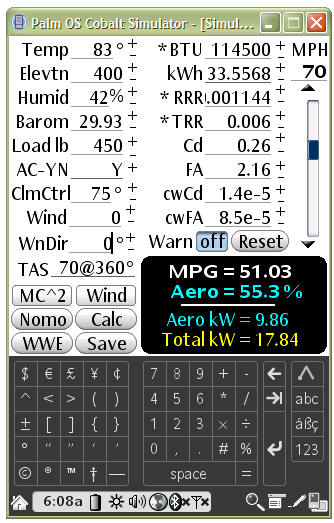
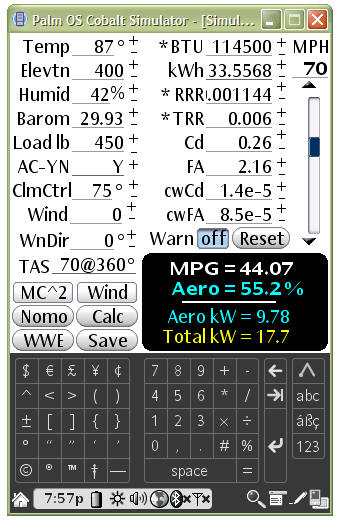
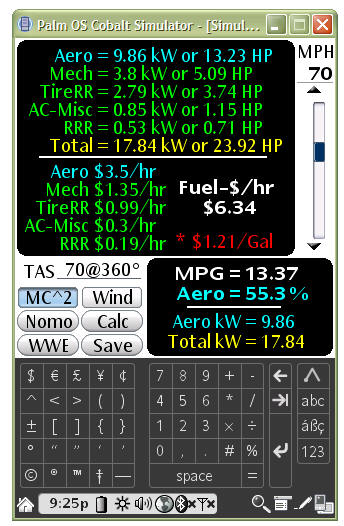
Notice in the screenshot below that I have changed the Fuel
$/hr value to $2.65/Gallon by clicking on the '*' and the program updates the
cost/hr value immediately. Notice also that extra information (this is
user optional) is available on the Hi-Res Palm devices such as the button
showing '04-06 Prius' letting the user know which motive device he is
calculating for, the MPG area showing more energy use detail & more.
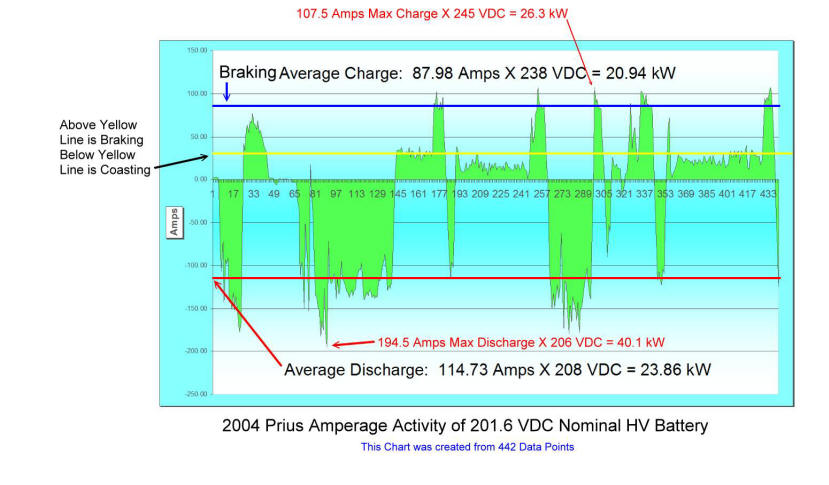
Graph from Data gathered off maiden voyage of first amperage tracking & logging equipment run
in late October 2003 on the new HSD in a 2004 Prius. This was some
of the first data any of us had to help us know a little bit more about
what the new HSD in the 2004 Prius was up to.
This data changes with ambient & operating temperatures by as much as
+/- 20%.
See screenshots showing All Variables
involved in Prius Synergy Simulator Calculations.
The Palm units below show all the Input variables involved,
some of which are
hidden in the above screenshots. These units show that the only variable
changed to go from 43.02 MPG to 53.55 MPG is an 8 MPH wind direction from
exactly opposite directions.
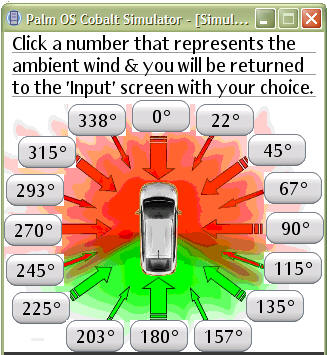
The first screen is
provided because sometimes it is confusing to know exactly what number to enter
in the 'WDir' or Wind Direction field in the 'Input' screen. This Wind
Direction Assist screen is accessed by clicking on the '*' next to the 'WDir'
label out on the 'Input' screen. If you click on any of the Wind Direction
buttons; lets do the '203º ' button; you
will return back to the 'Input' screen with that Wind Direction being
automatically entered for you & the simulator will recalculate itself
manifesting the new results as seen in the second photo below. Why do we
need to bother with Wind Direction input? Because it is a
VERY BIG DEAL.
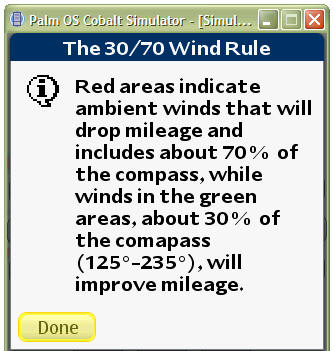
Notice the 'muddy' kind of color mix as you transition from
red to green. This is purposed as this is an area that can be either
detrimental or beneficial to mileage and is governed by a combination of both your
vehicle
and ambient wind speeds. The simulator calculates the 'muddy' area for you
and lets you know if it is good or bad in your particular situation. As
a general rule of thumb, you can figure that if you live or travel in a
windy area, you have about a 70%
chance of having poorer mileage than someone that does not live in a windy area.
A quick check of the simulator will tell you if your winds are helping or
hurting.
If you click anywhere in the red/green
areas in the first screen above you will get the popup message that shows in the
screen below. There are more than 70 different informative popup
screens like the '30/70 Wind Rule' below which provide very helpful information.
Like the '*' that brought up the 'Wind Direction Assist' screen
above, every '*' on the Input screen provides 'Assist' screens where the
variables that need to be entered are made more understandable & are
automatically brought back to the 'Input' screen and computed into the overall
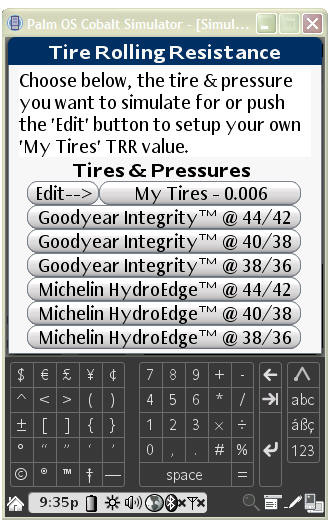
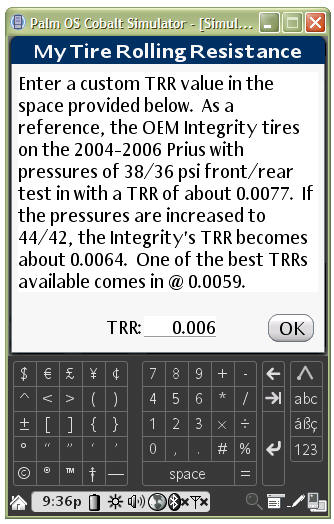
picture. Currently there are five '*' that bring up five
different Assist screens for difficult things like TRR,RRR,Wind Direction,
BTU/Fuel/kWh choices, Cost/Energy Breakdowns and then there are other Assist
screens that are accessible with buttons such as the Nomograph,Well to Wheel
efficiencies, Aerodynamics, Crosswind Corrections to FA, Cd & even the many effects of
Weather and its many, many variables; things like air density,
slushy roads &
hard rains. All of these Assist screens allow any user to quickly
understand & input variables that even a seasoned engineer would find difficult
to calculate without consulting reference texts for formulas & a good scientific
calculator or a large pre-programmed spreadsheet full of formulas.
I used to use a large spreadsheet & I thought it was wonderful but, using this
Palm Synergy Simulator is not only way more convenient in size and portability
but, it provides much more information instantly, graphically & dynamically at the very moment I input any changes in speed, temperature, winds, elevation
or any other variable that is constantly changing in our 'Real World.'
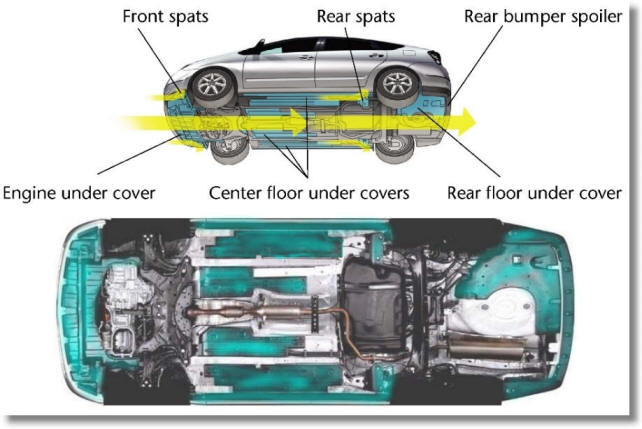
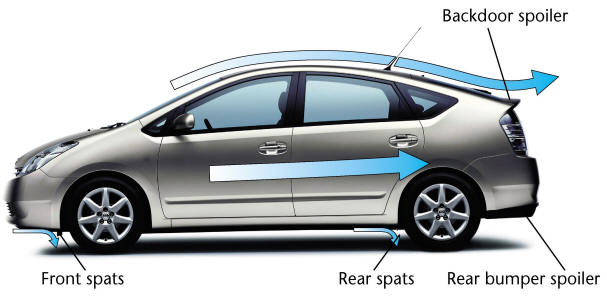
Under covers added to underbody for
better aerodynamics. I colored the covers with light blue so that they
would be easier to identify. The bottom photo is an actual photograph of
the bottom of a 2004 Prius.
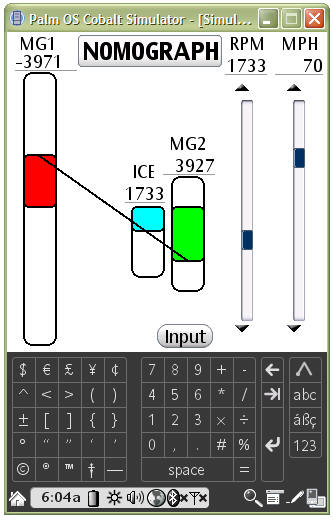
The first simulator screen below shows
the 'Nomograph' which illustrates the RPM of each of the 3 motive devices that
power the Prius as they are related through the Planetary Gear system which is
essentially the Prius transmission. Simply manipulate the sliders on the
screen and watch the relationships & values dynamically change in real time.
Notice in this screenshot that MG1 (Motor/Generator #1) is running backward @
-3,971 RPM while propelling the Prius forward @ 70 MPH. The RPM range of
MG1 is constantly changing from forward rotation to reverse rotation in direct
accord with the speed & engine RPM values. This is a very interesting and
informative screen and reveals some of the depth of engineering ingenuity Toyota
has put in the Prius.
The screen on the right shows all the same
variables as the shots above but, 'Without' any 8 MPH winds giving us 51.03 MPG.
Notice the 'Elevtn' field. Elevtn stands for Elevation
(not very much screen real estate on a Palm device)
or Altitude above sea level. Did you know that if we were do nothing more
than to enter 5,400 feet into the screen on above-right instead of the 400 feet
it has now, we would go from 51.03 MPG to 57.29 MPG. Many of the Western
States such as Colorado, Idaho, Nevada, Wyoming, Utah, Montana, the Dakotas,
California, Oregon, Washington, New Mexico, Arizona & more have thousands &
thousands of miles of freeway at or above 5,400 feet and if you drive carefully
on those highways in a Prius, you can get great mileage. In fact there are
many places in Utah, Colorado, Wyoming & Idaho with highways in excess of 7,000
ft. above sea level. If we were to put 7,400 feet in the simulator we
would see that our mileage would go from 51.03 MPG to 60.25 MPG & this is at 70
MPH! The simulator shows us these things very accurately & very quickly.
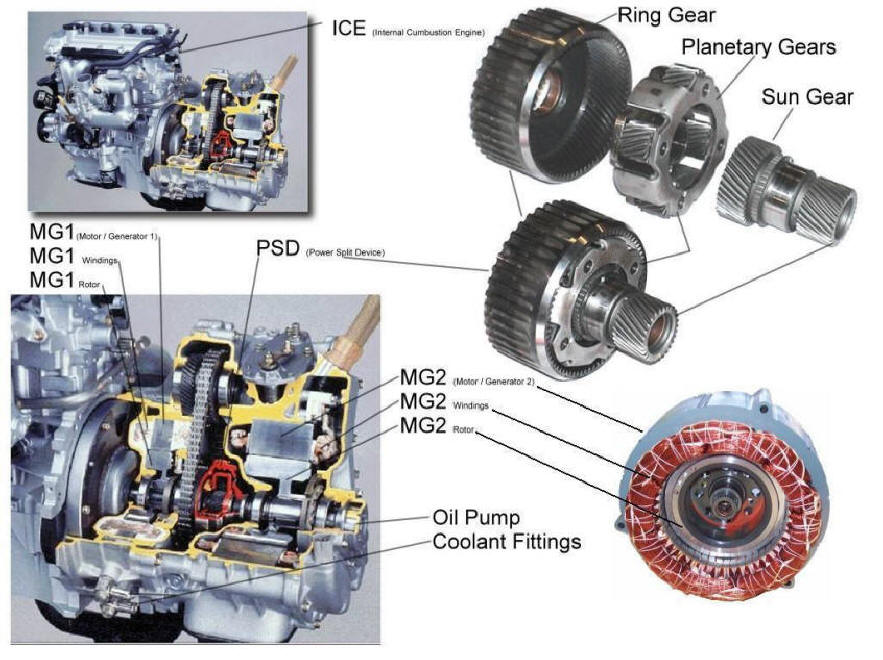
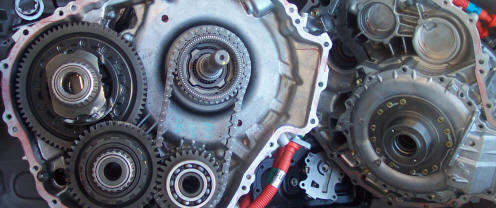
Below find some photographs & detail on the
Planetary Gear set mentioned above and see how MG1,
MG2 & the ICE are mated through the PSD. The
Nomograph shows us how these 3 Motive units relate to one another through
the Planetary Gear Set. This display is from some photos I worked up on
the 1997-2003 model years; the 04-06 units HSD™
(Hybrid Synergy Drive™) are very
similar and so I have chosen to not update the display.
Sometimes disassembly is what it takes to figure out what's
new about new technology!
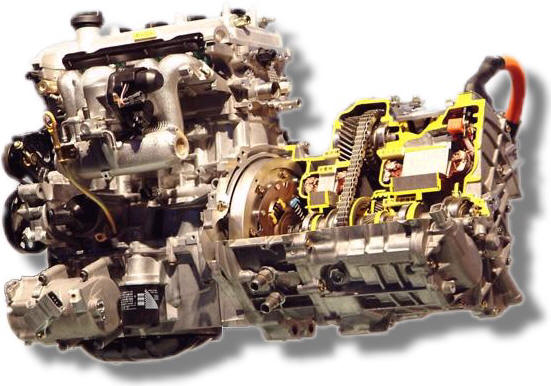
Hybrid Synergy Drive (HSD)
The most sophisticated production hybrid system is
Toyota's Hybrid Synergy Drive (HSD). HSD is featured in the
second-generation Toyota Prius, which launched in 2003 as a 2004 model year
vehicle and the Toyota Highlander Hybrid, which launched in 2005 as a 2006 model
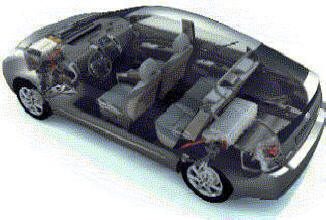
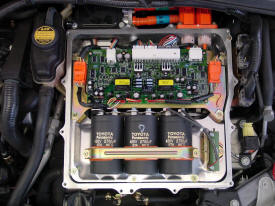
year vehicle. Below is a shot of the newer HSD™
(™) Hybrid Synergy Drive. Notice the electronic AC unit hanging just in front of
the oil filter. It certainly is nice to have air conditioning when in 'EV
Mode' or 'Stealth Mode' during the hot months. You can see how
similar the design is to the 1997-2003 THS™
(Toyota Hybrid System™) unit above.
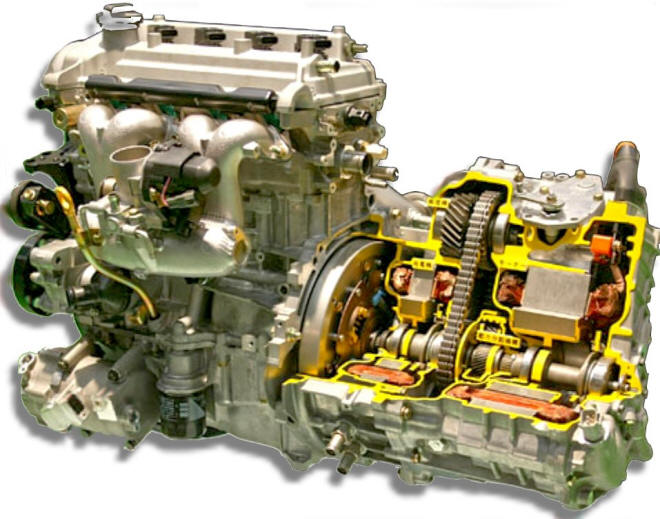
While we are looking at cutaways; one interesting thing that
Toyota does with its highly touted Atkinson Cycle ICE (Internal Combustion
Engine) is seldom, if ever commented upon. I have taken one of their
drawings of the Prius Atkinson Cycle engine and colored it up so that we can see
that they use an off-cylinder-center-line crankshaft position to help garner the
incredible efficiency this engine manifests. This off-cylinder-centering
of the crankshaft allows the TDC (Top-Dead-Center) of the piston to be achieved
AFTER the crankshaft has passed its rotational TDC and is in its downward motion
ready to better absorb and transfer the already improved Atkinson Cycle
combustion forces.
I have been asked several times if
there really is very much of the braking energy being captured & put back in
the battery through Toyota's upgraded HSD Brake Regeneration System. I
have run a lot of tests and shown a lot of data to the groups over the years
so, we knew the updated HSD was significantly better at capturing brake energy
than the 'Regen' in the first US release of the Prius.
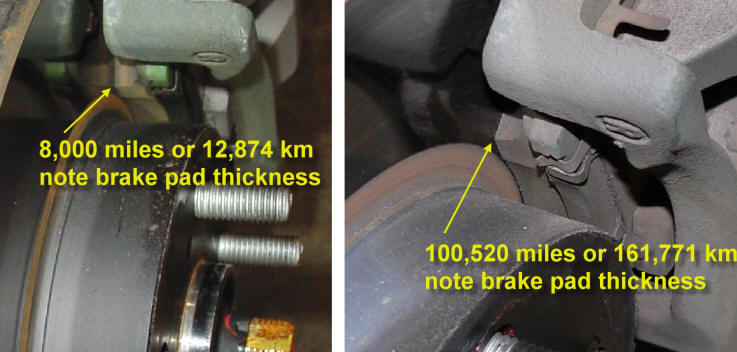
Recently, I went out and took a photo of my brake pads on the right front wheel
after 100,520 miles of use. These are the original brakes that came on the
car. Fortunately, I had taken a photo of the same pad at 8,000 miles when
I was having my tires rotated. The data I had collected over the last two
years told me I was capturing a lot more of the energy that is
normally wasted but, as they say "a picture is worth a thousand words." My
normal cars generally go through at least one set of brakes and often 2 sets before 100,000 miles.
At 100,520 miles, I literally could not measure any wear on these pads with my
metal mm ruler. I know there has to be some wear but, it appears that I
will have to remove the pads and use a pair of calipers to measure such a small
amount. This is pretty incredible!
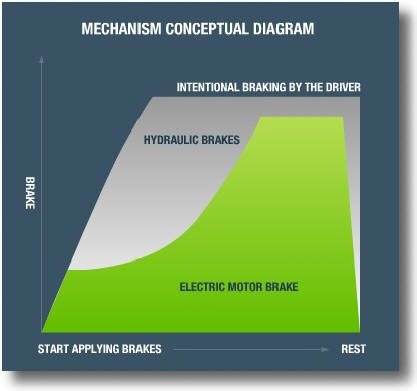
Toyota provides an illustration (below) that gives us a general idea of
how the Brake Regenerative mechanism operates. I used to try & make sense
of these graphs but, I now leave that to the reader's ability to decipher.
What I can say is; after inspecting my brakes, as can be
seen in the above photos, the new HSD Brake
Regeneration System does a fine job of capturing the normally wasted braking
energy.
See some of the new features
in the Palm program's latest release.
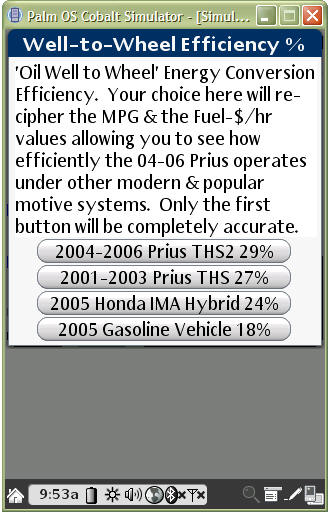
This screen allows us to choose
other modern & popular motive systems to see how well they might do under
exactly the same variables. The screen on the right shows us that if we
choose to run the 2005 Honda IMA hybrid system in our Prius under exactly the
same variables we would drop from 51.03 MPG to 44.07 MPG. I am excited to
see how well the new 2006 Civic IMA system does. Running this
same data for the latest 2005 Gasoline Engines, we come up with 29.86 MPG in our
Prius ... OUCH, that is the technology we use in almost all of our overly
ubiquitous SUV fleet here in the USA!
*HSD = Hybrid Synergy
Drive - Second Generation Toyota Hybrid System
**FCHV = Fuel Cell
Hybrid Vehicle - Toyota's Projected (Not Yet Achieved) Goal for Hydrogen Fuel
Cell Vehicles incorporating their latest Hybrid System
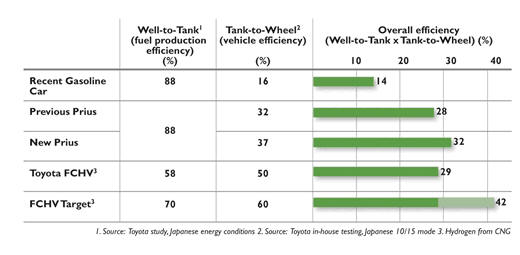
Just to show that there is a considerable amount of confusion on
Well-to-Wheel efficiency, even within Toyota itself, find below a chart taken from
http://www.toyota.co.jp/en/tech/environment/hsd/04.html . I use the
above chart for now as it is more conservative and a little nicer to current
gasoline car efficiency ratings which show 19% above & 14% below. Do note
however, that the 'New Prius' is rated 29% above & 32% below. All the
calculations that the simulator uses shows that the 32% figure below is likely
closer to reality but then, all you have to do is change the BTU content of the
fuel on the Input screen and you can make the above 29% work also; that is
exactly why I have put other vehicle motive systems choices on the
screenshot above; so, we can compare real apples
to real apples no matter what BTU value we use in the 'Input' screen.
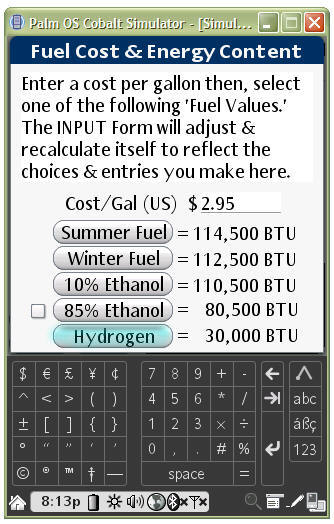
The screen on the left will allow us to
see how well the Prius would do on several different fuels. If we
choose Hydrogen and run exactly the same variables as above, we drop from 51.03
to 13.47 MPG & this would be with a full THS II or HSD, Hybrid Synergy Drive
Hydrogen system. Even if we could afford to carry
hydrogen in a liquid state (liquid tanks are heavily insulated, very large, very heavy &
way too expensive), we
would have to have a 45.4 gallon fuel tank to get as much energy into our Prius
as we do with our 11.9 gallon gasoline tanks now. If we were to 'not' use
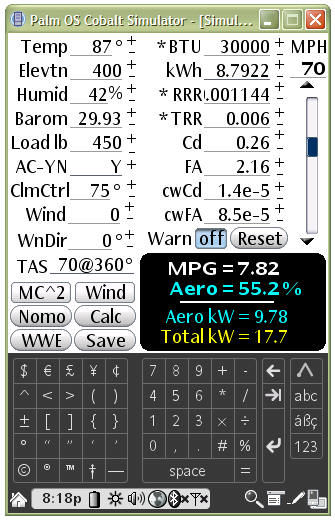
our THS II hybrid system and go to a normal internal combustion engine, we would
drop to 7.82 MPG on hydrogen. The Palm program shows us all these things
very quickly.
A note on hydrogen: The fuel cells being developed today
are actually turning hydrocarbon fuels into hydrogen which is then turned into
electricity to run electric motors. Although the hydrogen industry hopes
to achieve about the same miles per $ as gasoline gives us today; the best of
them today have 'Well to Wheel' efficiencies that are still significantly less
than the 04-06 Prius. The Prius, as shown in a screenshot above, achieves
a Well to Wheel efficiency of 29%.*** The best Fuel Cell systems out are
converting at
about 21-22%*** (hydrogen fuel cells extract hydrogen from hydrocarbon fuels such
as natural gas, methanol, and even gasoline). The cost of the system is
currently & completely out of reason and the cells are presently manifesting
very poor longevity. The industry still has a very long way to go.
The most positive industry representatives say no Hydrogen Infrastructure before 10 years while most
others state 15-20 years before the 'Hydrogen Highway' is a reality. Even
Toyota, who has very lofty goals for hydrogen, predicts that that we are decades
away form being able to effectively use hydrogen vehicles such as their
FCHV. Until then,
hats off to Toyota for making hybrid vehicles which are more efficient than the best
fuel cells of the day & already have excellent longevity & pricing. These hybrids will help carry us to whenever the Hydrogen
Utopia
or something else becomes
our new energy reality.
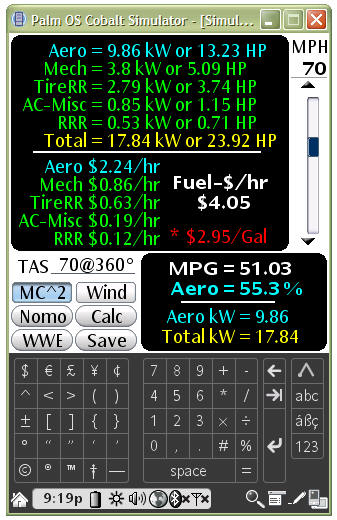
The screenshot on the left shows the
energy breakdown & cost of running gasoline at $2.95 a gallon which gives a
$4.05/hr operating cost @ 70 MPH. Even if Hydrogen fuel were to cost $1.21
(1989 estimated cost) a gallon/US, we Prius owners would have an operating cost of $6.34/hr @ 70
MPH; this is reflected in the screenshot on the right.
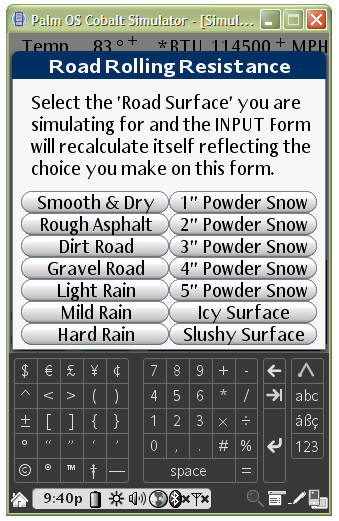
See some more of the Help/Assist
screens for data entry
The Help/Assist screenshot on the
below helps us correctly set the type of Roadway surface we are
simulating for. A heavily rain-soaked highway can rob you of a lot of MPG.
Almost every label identifying an 'input' field in the
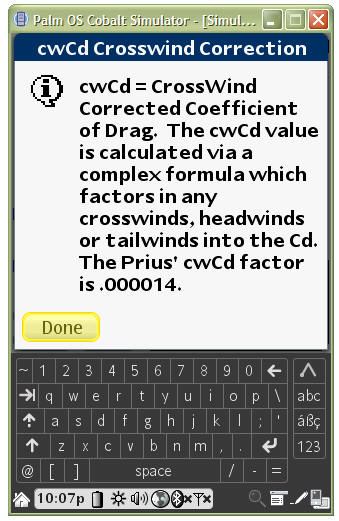
program will popup an information screen akin the that shown below. If you were to click the 'cwCd'
label on one of the above 'Input' screens you would get an 'Info Popup' screen
as illustrated in the lower right screenshot. Crosswind Correction factors
or formulas are unique to this simulator. In fact, I could not find any
data or formulas on this subject and I had to fit two different Prius vehicles
with anemometers, wind direction equipment & data loggers for more than 30,000
miles (people thought I was a storm chaser) to come up with the formulas &
factoring values used in this program. I have yet to hear of a simulator
that has this feature and yet it is such an important variable to know as it
'wildly' affects our mileage for good or bad any time the ambient winds go above
5 MPH.
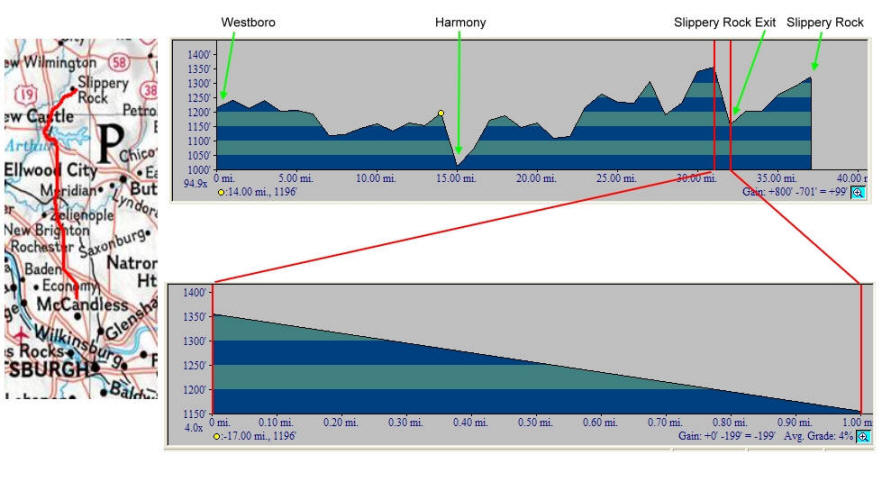
Some of the early SOC pre-staging
via GPS-Terrain-Following work begun back in early 2004. This is part of
an actual route followed by a State & University sponsored rally that I had
friends participating in and had provided for their use that year. If you
pre-stage your SOC for what is upcoming in terrain, you can really improve your
mileage. In a nutshell, use up most of your SOC before going downhill &
get great mileage while doing so. Now, as you approach your downhill run,
your SOC is way down and you can capture more of the normally wasted downhill 'regen'
energy that a normally held SOC could not handle. After bottoming
out, hold your newly elevated SOC high until it is time to begin climbing so as
to have more EV or electrical assist available going up the next hill.
With extra Ah of battery power, GPS based terrain awareness,
corrected crosswind data & the proper
algorithms which accurately calculate & pre-stage your SOC, you can get up to 25% better fuel mileage. This is a very exciting area that Toyota
& Denso jointly have in patent pending status.
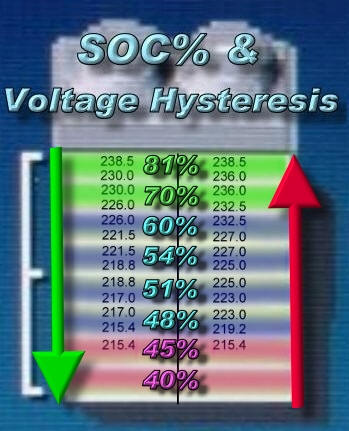
Full SOC (State of Charge) & associated voltages showing I/O hysteresis
@ 70ºF (varies with temperature ±20%).
The 'Terrain Following' logic is SOC-centric & so it is very important that we
know how the SOC for our batteries works. The illustration below shows
a red arrow going up and a green arrow going down (This is counterintuitive to how we usually look at this Icon). Green shows us the
voltage hysteresis of each bar as the Prius gets electrical assist (Green for
improved mileage) & Red shows us the voltage hysteresis per Icon bar as the
battery charges which 'takes' energy from the ICE or from regeneration. It
should be understood that any energy gained from regeneration was, in almost
every case, initially provided by the ICE. The only natural but often
experienced exception to this is, regeneration energy captured from tailwinds.
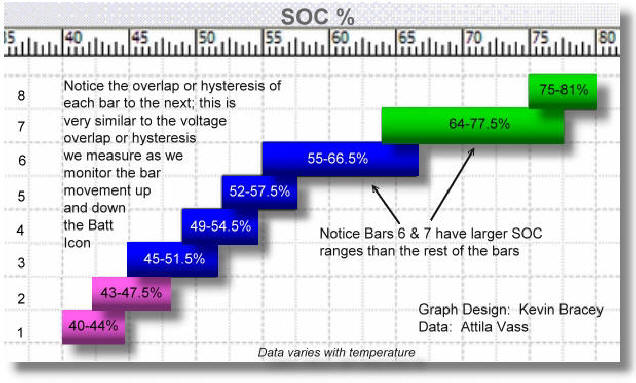
The SOC % values were determined from my own data collection & that of Attila
Vass who's most excellent work on monitoring regeneration amperages vs. speed
vs. SOC% can be seen at
http://www.vassfamily.net/ToyotaPrius/CAN/rechargeindex.html ; while there
take a look at his other astounding work on his Prius & especially the small
notebook-like Linux based computer he uses to monitor the Prius' CAN system.
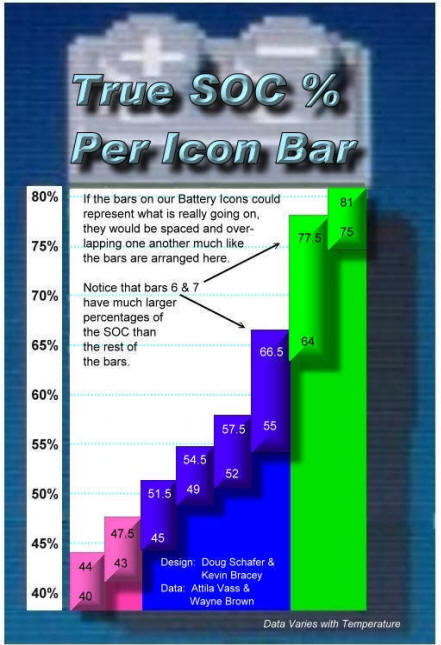
True SOC % per Battery Icon Bar. This graphical illustration
'stretches' the Icon bar vertically allowing each bar to be better represented
by what is happening in reality. Notice bars 6 & 7 span a much larger
range of the SOC than the other bars. This seeming phenomenon of bars 6 &
7 spanning a larger range than the other bars is what happens in reality.
If you look at the voltage ranges in bars 6 &7 above, you will notice that the
ranges are comparable to the other bars & this really doesn't make much sense
when looking at the SOC % ranges below. It all comes together though &
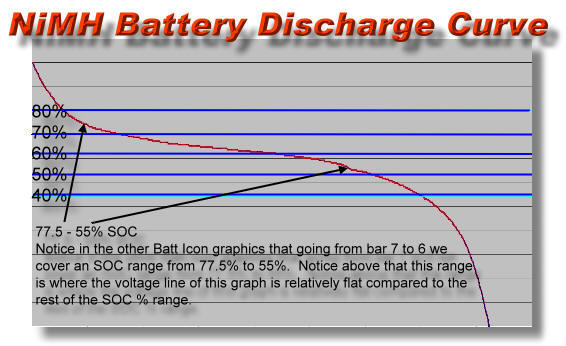
begins making sense if we look at a discharge graph for the Prius NiMH battery.
Notice that the voltage ranges for bars 6 & 7 although comparable to the other
voltages per bar ranges, covers most of the 'flat' area going from left to right
which is indicative of time in those ranges. Now it begins to make sense
as to why we stay in bars 6 & 7 longer.
This kind of system matches very nicely with the GPS based Navigation
computer already in the Prius. If you preset a trip, the Prius
already knows your route and only has to be 'aware' of the terrain data along
your route. The system only needs terrain data for an area that is about
60 feet X about 5 miles (dependant upon Ah) to properly pre-stage the SOC It knows within about 15 feet where
your are via GPS location. It knows how fast you are going, it knows
if there are towns ahead where you may reduce speed, it knows what the ambient
temperature is, it knows how fast you have been traveling for the last 5 minutes
and last but not least it should also be fed ambient wind conditions.
As can be seen above, crosswinds, headwinds &
tailwinds can consume or contribute incredible amounts of energy so, it is very
important to add those kind data points to the algorithm also. I have
spent several enjoyable years working on this and some other technology and can
attest that with the advances we are making in electronics and etc; all of this
will soon be available to us at fiscally responsible pricing & well worth
our personal investment. A Prius that gets 50 MPG will very likely be able
to get 60+ MPG using nothing more than this technology. Most of the
hardware is already in a Prius that has the Navigation option. Add a
solid-state anemometer, highway terrain data, some updated code & we are there!
$3.00+ a gallon fuel pricing in the US will likely place this technology into
public use even more quickly than without fuel prices rising.
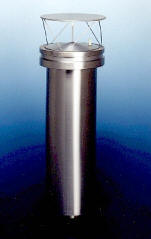
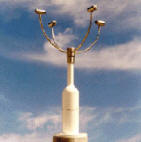
Dual function, solid state anemometers such as in the above photos, make
gathering ambient wind data much nicer looking than the
anemometer you see on my 2002 Prius.